How to Do Load Testing for a Website: Locust & JMeter Guide for QA
Learn how to load test a website or API with Locust and JMeter. Step-by-step performance testing for QA — install tools, run your first website load test on staging, read results, and report bugs.
Normal QA checks if the app works for one user. Load testing checks if your website or API still works when many users hit it at the same time. If you want to know how to do load testing for a website — or how to test website performance under load — this guide walks you through your first website load test on staging, step by step, using Locust (Python) for API load testing and, if your team prefers a GUI, JMeter.
What is load testing for a website?
What is load testing?
You send many requests to the app on purpose — login, search, checkout — and watch how fast responses come back and how many fail. You control how many fake users run at once.
Load vs stress vs spike vs soak
Four common test types (plain words)
| Type | What you do | What you learn |
|---|---|---|
| Load test | Run busy-but-normal traffic for several minutes | Does the app stay fast enough at expected peak? |
| Stress test | Keep adding users until something breaks | Where is the limit? |
| Spike test | Jump from low to very high traffic fast | Can it handle a sudden rush? |
| Soak test | Moderate traffic for many hours | Do slow problems build up over time? |
Start with a basic load test before a big release. Run it on login, checkout, enroll, or any API your team cares about.
How to load test a website with Locust (step-by-step)
Locust is free, Python-based, and a popular choice for Locust load testing on APIs and web endpoints. Follow these steps on a machine where you are allowed to run tests (your laptop or a CI runner).
Step 1 — Install Python and Locust
Locust needs Python 3. Check if you already have it:
python3 --version
# or on Windows:
python --version
If Python is missing, install it first:
- Windows — download the installer from python.org (check Add Python to PATH during install)
- macOS — run brew install python3 or use the installer from python.org
- Linux — run sudo apt install python3 python3-pip (Ubuntu/Debian) or your distro equivalent
Then install Locust with pip:
pip install locust
# or if pip is tied to python3:
pip3 install locust
Confirm it worked: locust --version should print a version number.
Step 2 — Create a simple locustfile.py
Make a new folder for your test (example: load-test-demo). Inside it, create locustfile.py with one fake user that hits a staging health endpoint. Replace the host with your team's staging URL — only if you are authorized to test it.
from locust import HttpUser, task, between

class StagingUser(HttpUser):
    # Pause 1-3 seconds between requests (acts like a real user)
    wait_time = between(1, 3)

    @task
    def health_check(self):
        self.client.get("/api/health")
That is enough for a first run. One user type, one GET request. You can add login or POST calls later once this works.
Step 3 — Start Locust
Open a terminal in the folder with locustfile.py and run:
locust -f locustfile.pyLocust starts a small web server. By default it listens on port 8089. Leave this terminal open while the test runs.
Step 4 — Open the web UI and set your test
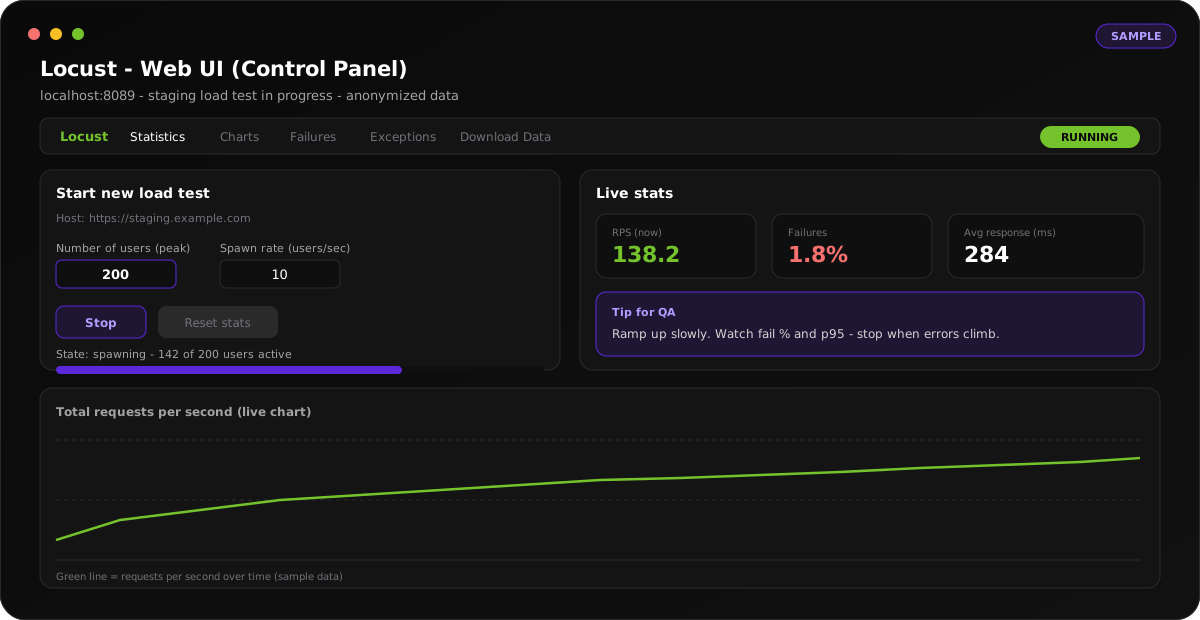
In your browser, go to http://localhost:8089. You will see a form with these fields:
- Number of users — how many fake users run at the same time (start with 10, not 200)
- Spawn rate — how fast users are added (example: 2 users per second)
- Host — the staging base URL (example: https://staging.example.com)
Step 5 — Start the test and watch the numbers
Click Start swarming. Locust sends requests to your staging host. Watch these columns on the Statistics tab:
- RPS (requests per second) — how many requests the server handled each second. Higher usually means it is keeping up.
- Failures — percent of requests that failed (500 errors, timeouts). Should stay at 0% or very close.
- Average / p95 response time — how long requests took. p95 means 95% finished within that time (better than average alone).
Ramp up slowly. Go from 10 users to 25, then 50, then 100 — and stop when failures climb or p95 gets too high.
Step 6 — Stop, save results, and write your report
- Click Stop in the Locust UI when you have enough data (usually 5-10 minutes per step).
- Go to Download Data and export the stats (CSV) if you need to attach them to a ticket.
- Note the user count where things got bad — that is your fail point.
- Write a short summary for the team (see sample table below).
- Log bugs with clear numbers — example: POST /api/courses/enroll p95 > 2s at 180 users, 4% errors.
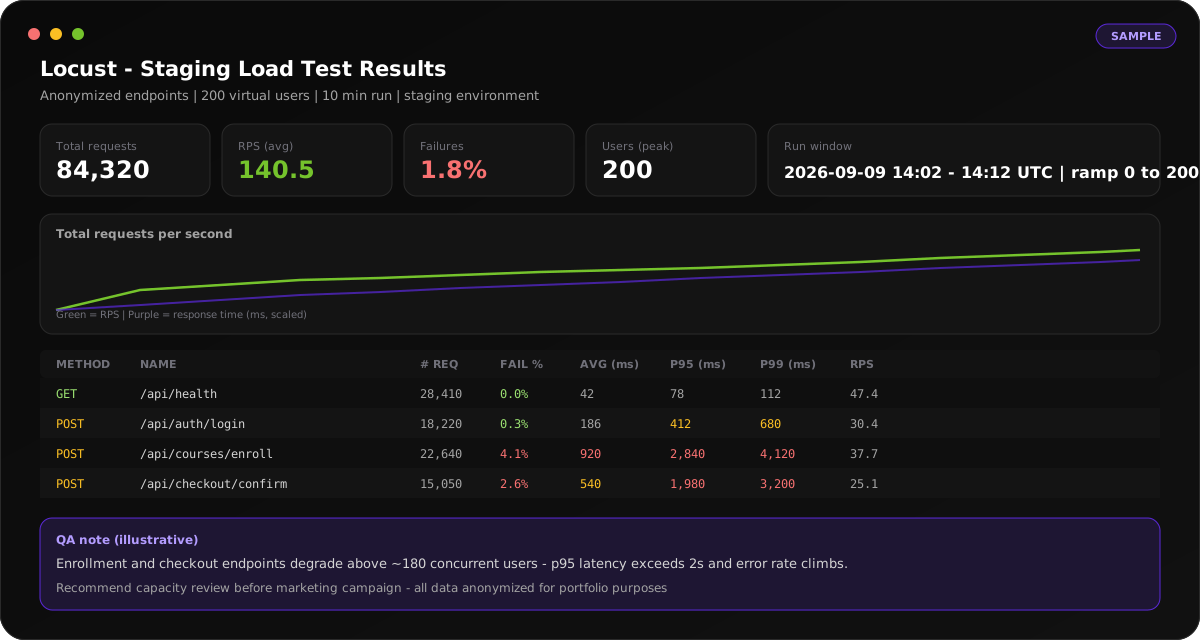
Sample report you might send to devs (anonymized)
| Endpoint | RPS | p95 | Errors | Notes |
|---|---|---|---|---|
| GET /api/health | 47 | 78 ms | 0% | Fine the whole run |
| POST /api/auth/login | 30 | 412 ms | 0.3% | OK under ~150 users |
| POST /api/courses/enroll | 38 | 2.8 s | 4.1% | Slow above ~180 users |
| POST /api/checkout/confirm | 25 | 2.0 s | 2.6% | Payment timeouts at peak |
Attach the CSV export and name the build version. These numbers are made up to show the format — your real report uses your staging results.
JMeter load testing: step-by-step GUI path
Use JMeter load testing if your team already works with .jmx files or prefers a desktop GUI over Python. Same rule: test staging only, with permission.
- Download Apache JMeter from jmeter.apache.org and install Java if prompted.
- Open JMeter and create a Test Plan. Right-click Test Plan, add Thread Group.
- In the Thread Group, set Number of Threads (users), Ramp-up (seconds), and Loop Count (or duration).
- Right-click Thread Group, add HTTP Request. Set server (staging host), path (example: /api/health), and method (GET or POST).
- Add a listener: right-click Thread Group, add Summary Report (or View Results Tree for debugging single requests).
- Click the green Start button. Watch throughput (requests/sec), average time, and error % in the listener.
- Stop when done. Save the .jmx plan in git and export results for your report.
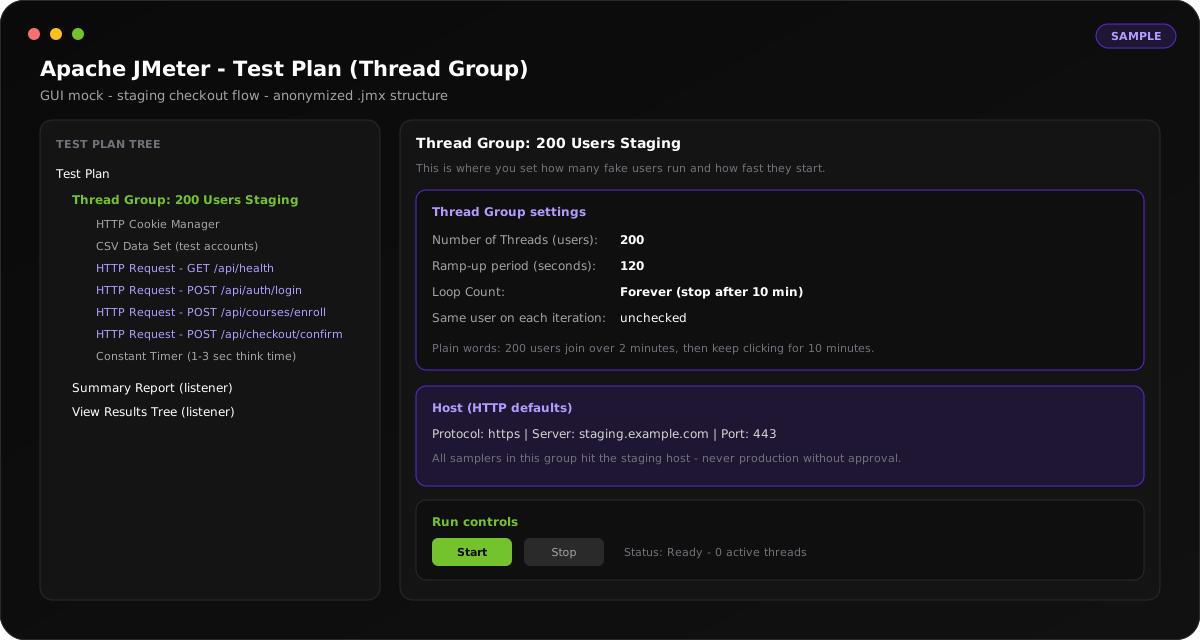
Thread Group = your group of fake users. You set how many, how fast they start, and how long they run.
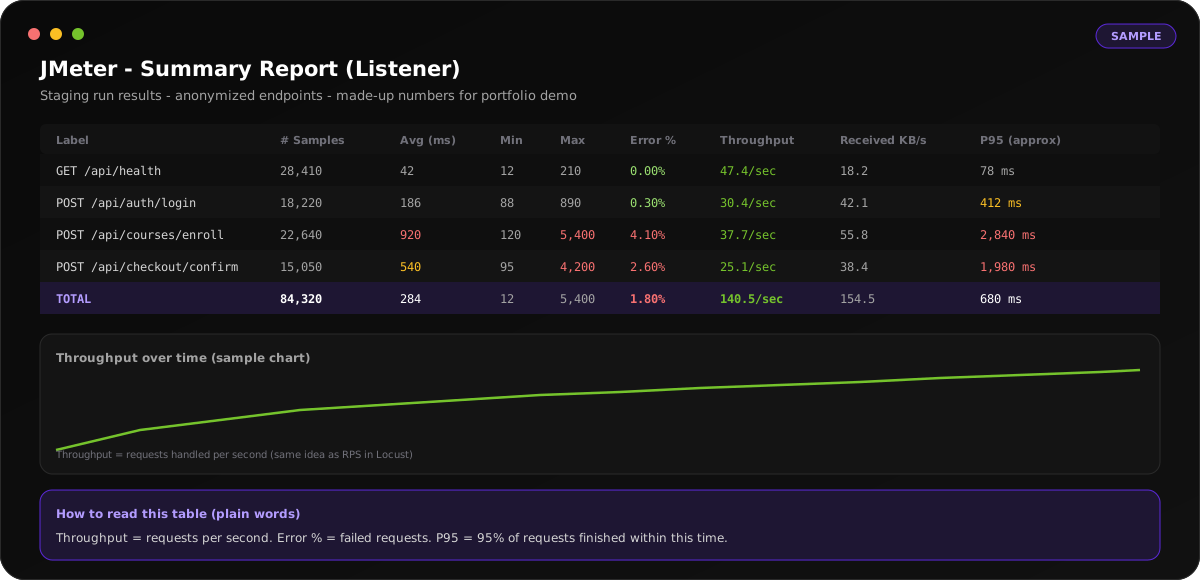
Key terms (plain words)
- RPS / throughput — requests handled per second
- Response time / latency — how long one request took (lower is better)
- p95 — 95% of requests finished within this time; catches slow outliers
- p99 — slowest 1%; use with p95, not instead of it
- Error % — share of failed requests; should be near 0% on a healthy run
- Fail point — the user count where errors or slowness clearly got worse
Common mistakes to avoid
- Testing production without written approval — use staging
- Starting with too many users — ramp up slowly
- One test account for 500 users — not realistic; use a CSV of test accounts
- Skipping warm-up — first minute after deploy may be slow; warm up or ignore early data
- No target numbers — agree limits before you run (example: login p95 under 500 ms at 100 users)
Load testing does not replace normal QA or API testing. It adds one check: the product works, and it keeps working when traffic goes up.
Frequently asked questions
How do I load test a website?
Pick a tool (Locust or JMeter), point it at your staging URL — not production — and simulate many users hitting key pages or APIs at once. Start small (10 users), ramp up slowly, and watch response times and error rates. The Locust and JMeter sections above walk through each step.
How do I check load testing results for a website?
Look at three things: requests per second (throughput), response time (especially p95), and error percentage. If errors climb above ~1% or p95 blows past your team's target (for example, login over 500 ms), you have found a problem worth reporting. Export CSV from Locust or JMeter and attach it to your bug ticket.
What is Locust used for?
Locust is used to simulate many users sending HTTP requests to a website or API at the same time. You write a small Python file (locustfile.py), start the Locust web UI, set user count and host, and run the test. It is especially good for API load testing and quick staging runs.
What is JMeter used for?
Apache JMeter does the same job as Locust — fake users hitting your site under load — but through a desktop GUI. Teams use JMeter when they already have .jmx test plans, need visual test-plan editing, or prefer not to write Python.
What is performance testing for QA?
Performance testing for QA means checking that the product stays fast and stable when traffic goes up — not just when one tester clicks through. Load testing is one type of performance test. QA engineers often run it before big releases on login, checkout, search, or critical APIs.
How do I test website performance under load?
Agree on target numbers first (example: checkout p95 under 2 seconds at 100 users). Run a website load test on staging, ramp users from 10 to 50 to 100, and stop when errors or slowness get worse. Compare each run, note the fail point, and share a short report with devs — the sample table in this guide shows the format.
API Testing with Postman and SQL Validation
Check that APIs return the right data before you load-test them.
Test Planning for Release-Ready QA
Where load testing fits in your release checklist.
QA Work Samples and Artifacts
More sample reports and QA evidence (all anonymized).
Locust docs — What is Locust?
Official guide to installing and running Locust.
Apache JMeter — Getting Started
Official guide to building your first JMeter test plan.
Need release-ready QA support?
Hire MD Masfiqur Rahman for Playwright automation, API testing, mobile QA, accessibility checks, and production readiness — remotely worldwide.